The impact of the various sources of economies and diseconomies of scale on the market structure
1. Introduction
When we think of automatization and mass production Henry Ford comes to mind. What might have been his idea when he set up mass car production using assembly lines? From the introduction of the Model T in 1908 until 1927 Ford set a production record of 15m cars which remained unbeaten for 45 years. This concept of mass manufacturing to decrease long-run average costs but increase profits, came to be known as economies of scale which were the main drivers of corporate gigantism in the early 20th century.
In the following, economies and diseconomies of scale will be examined, the impact of minimum efficient scale, the minimum size of a corporation to produce at the lowest cost shall also be illuminated. With reference to the German car manufacturing and the pharmaceutical industry it will be discussed how various sources of economies and diseconomies of scale impact on the market structure of relevant industries.
2. Significance of Minimum Efficient Scale and its impact on the market structure
To explain the term Minimum Efficient Scale it is necessary to have a closer look at the terms Economies of Scale and Diseconomies of Scale.
Economies of Scale refer to a firm’s ability to mass produce a product and sell it at a lower price than competitors who may not have the means to mass produce and thus would not be able to compete on price, thus are forced to find other ways to differentiate themselves from the competition. Silberston once expressed:
Classic economies of scale relate to the effect on average costs of production of different rates of output, per unit of time, of a given commodity, when all possible adaptations have been carried out to make production at each scale as efficient as possible. (Silberston, 1972, p. 369)
Froeb et al. (2014, p. 76) defined: “If long-run average costs fall with output, you have increasing returns to scale or economies of scale.” In contrast: “If long-run average costs rise with output, you have decreasing returns to scale or diseconomies of scale.”
According to Mankiw (2012, p. 273), economies of scale often originate from highly specialised workers due to higher production levels, permitting workers to improve their skills at
specific tasks. Diseconomies of scale may be caused by coordination problems inherent in larger organizations.
2.1 Minumum Efficient Scale (MES)
The term Minimum Efficient Scale is used to describe the lowest output a
plant or organization can produce so that the long-run total average costs (LRATC) are minimized in the future (Begg & Ward, 2013, p. 74). The MES, on a long-term perspective represents the lower limit of the economic price; it is an
important factor for calculating the production’s profitability. Its antagonist is the operating minimum, the short-term price floor covering only variable costs. Therefore a product’s selling
price must not fall below the minimum average cost so to cover all expenses. Selling a product at the minimum average cost would create no profit. What else is there to consider?
A company not covering its total costs (variable and fixed) generates a
loss, therefore the primary goal is to cover all costs and to find the optimum to operate profitable permanently. Only in the short run it may be legitimate that the minimum average costs cannot
be covered as it often occurs with new products.
Often it is believed that the terms MES and the profit maximum can be used
interchangeably which usually this is not the case. Minimum efficient scale is much more based on economic criteria. In long-run equilibrium, under perfect competition, all firms select their
optimum size. Almost 250 years ago Adam Smith (Smith,
1976) already recognized that under ideal conditions, competition ensures that no company can generate positive earnings. All firms produce within their minimum efficient scale and provide
the product at minimal costs which Smith called the natural price, implying it is the lowest possible price for consumers.
2.2 The Impact of Minimum Efficient Scale on the Market Structure
The minimum efficient scale is the scale of production where the internal economies of scale have been fully exploited. The MES corresponds to the lowest point on the long run average cost curve and is also known as an output range over which a business achieves productive efficiency.
The MES is hardly ever a simple output but more likely can be described as a range of production levels where the firm achieves constant returns to scale and has reached the lowest feasible cost per unit. Where the proportion of fixed to variable costs is quite elevated, there is huge potential for lowering the average production costs. The MES and its connection to the overall market size or demand will determine how many competitors can successfully function in the market.
Where the MES is relatively small compared to the total market size many companies can
survive in the same space, e.g. computer software companies. In other industries with larger MES due to high fixed costs, few major players will dominate the market (e.g. telecommunication,
electricity).
For high ratios of fixed to variable costs, there is plenty of scope for reducing unit
costs by increasing the output scale likely resulting in a concentrated market structure (e.g. oligopoly, duopoly or even monopoly). In fact economies of scale can act as a barrier to
entry (Porter, 1979, p. 138) since incumbents have achieved cost advantages and can decrease prices if new businesses threaten to
enter.
In contrast there might be only limited opportunities for economies of scale if it turns out that the MES is only a small percentage of the market demand. It is likely that such market will be highly competitive with many companies being able to achieve MES, (e.g. the many hotels or restaurants in a city centre).
The industry’s market structure is affected by the extent of economies of scale available to individual suppliers and total size of market demand. In many industries it is possible for smaller
firms to make a profit because the cost disadvantages they face are relatively small. Product differentiation allows a business to charge a price premium to consumers which more than covers their
higher costs.
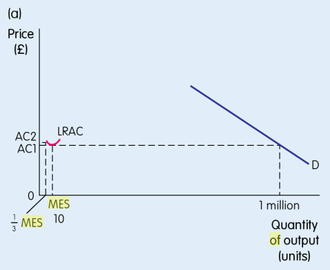
Figure 1 (Gillespie, 2014, p. 172) explains the relationship between minimum efficient
scale and market structure. If the MES and cost disadvantages of operating below it are low relative to the market demand, competition is high amongst many firms.
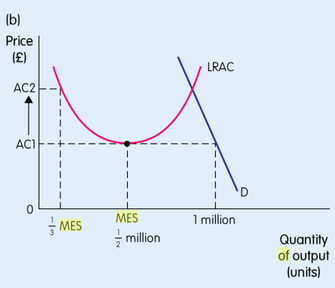
Figure 2 illustrates a high MES relative to market demand while the cost disadvantage of not operating at the MES is also high which means this industry is likely to be dominated by few firms.
3. The Impact of the Sources of Economies and Diseconomies of Scale on Market Structures
Many sources of economies and diseconomies of scale exist. With reference to the German car manufacturing industry, each source will examined to analyse their impact on market structures.
Size affects a firm’s efficiency. Large firms often can operate more
efficient benefitting from economies of scale. However, firms can grow too large and suffer from diseconomies of scale. Sources of economies and diseconomies of scale are of internal and external
nature as firms can grow internally or externally through mergers and acquisitions.
3.1 External Sources
Main sources of external economies and diseconomies of scale is the expansion of a whole industry and factors a firm usually has little or no control over.
A firm can benefit from external factors that influence the industry as a whole. Common example are:
-
Infrastructure: In an industry that develops in a particular region, a firm may benefit logistically (transport networks), communication and recruitment (pre-trained workforce) advantages (e.g. Silicon Valley or Bangalore)
-
Industry growth may allow specialist- or low-cost suppliers to settle in close proximity.
-
Large supply and low demand may reduce supplier’s power.
-
In a growing industry all costs may be driven down through technological improvements.
External disadvantages, costs outside a firm’s control resulting from growth of a specific industry:
-
Congestion of infrastructure because of industry growth in one specific region
-
Exhaustion of resources and price increases as demand outstrips supply
3.2 Internal Sources
Internal sources of economies and diseconomies of scale result from the
expansion of a single firm.
Purchasing economies of scale are achieved when larger firms buy in bulk and negotiate discounts, e.g. TESCO can buy its fresh fruit in larger quantities than smaller fruit and vegetable retailer.
Efficient inventory and supply chain management practices may also help reducing average unit costs, like DELL’s just-in-time inventory management.
To achieve marketing economies of scale, fixed costs of marketing materials
and expensive TV advertisements are spread over larger numbers of prospective clients (IPA, 2015).
Technology as another source of economies of scale means improving
production efficiency by using better, newer technologies, re-configuring machines or purchasing newer to fully use capacities. The larger the product volume produced, the more efficient can be
operated to finally be more cost-effective. Large, modern facilities enabling mass production can, despite huge initial investment, reduce unit costs, as fixed production costs, such as rent,
fuel or electricity, are spread over more units reducing the average cost of each unit. Thinking of Henry Ford again it is clear that capital-intensive industries must use technical economies of
scale to be profitable. Building only 100 cars per year would result in high fixed costs spread over few units only.
Similarly, spreading staff costs over higher numbers of produced units allows for higher potential investments in specialist expertise. Hiring specialised staff may seem expensive at first, however, professional staff may not only improve quality but even increase production. The higher labour costs incurred may be well compensated by this improved productivity and quality.
Thinking of Ford’s assembly line again, specialized labour will normally
also lead to increased efficiency as people doing the same task repeatedly tend to do it faster than those who do the task only occasionally.
Borrowing larger amounts of money is usually cheaper than smaller ones.
Bigger companies normally have more assets to use as collateral therefore interest rates are typically lower for them. Servicing costs for equity
financing are significantly lower than borrowing from financial institutions, this way larger companies can typically raise more money.
The more a company diversifies its activities, the less overall risk it
assumes in any one line of business. Producing a wide range of products, and operating in many geographic locations are ways to spread risk. For example large record companies more easily can
bear the risk of a ‘flop’ than smaller ones. Large-scale growth and diversification strategies can pay off by taking a long-term perspective using economies of scale. Spreading the risk of
research and development costs is another benefit for large firms.
3.3 The German Car Manufacturing Industry
The automobile industry is a great example of economies of scale. In the following a
closer look will be taken at the impact of economies of scale on the market structure of the German automobile industry.
Following Dankbaar (2011, p. 3) German car manufacturers' strategy of emphasizing scope over scale and innovation over productivity, “Not one car for different markets, but different cars for different markets”, increases the market share in spite of the fact that economies of
scale are not or only partially realized.
From an external perspective all afore mentioned factors apply to the German automobile
industry:
-
Overall global industry growth in the past 30 years.
-
Industry sectors in areas around large car manufacturing plants. Between Stuttgart (Daimler) and München (BMW) many vehicle supply industries settled.
-
Abundant specialist workforce is available, e.g. Wolfsburg (VW) has 123.000 inhabitants while its plant there employs 50.000 people.
Considering all the mentioned sources of economies of scale it appears, the German car
manufacturing industry experienced diseconomies of scale while at lower output levels in the 1980s but is now operating on an output range of economies of scale. At least three factors may be
responsible for this:
Spreading heavy costs of R&D to comply with ever tougher environmental regulation is
much easier for larger car manufacturing groups. (The Economist, 2014)
In the 1990s the German automobile industry made huge efforts in reorganizing production
processes to increase cost advantages through mass production techniques and to become more efficient. According to Krzywdzinski (Krzywdzinski, 2008, p. 16) the introduction of three-shift systems and
weekend-shifts have become an important topic of bargaining and conflicts in the late 1990s.
Following Spatz and Nunnenkamp (2002, p. 42) human capital intensity increased from 1982-2002 while the relative wage rate of low-skilled workers decreased. That development helped
Germany to cope with global competition and maintain its position among the world's top motor vehicle manufacturers. Low-skilled and labour-intensive links of the motor vehicle value chain are
pressurized from developing countries in Eastern and Central Europe, South East Asia and Latin America. As Carl-Peter Forster (2004), the then CEO of OPEL expressed it: “out of Germany or out of
business”. With Škoda In Czechia, Volkswagen in Slovakia and Poland and Audi in Hungary the Volkswagen-Group ranges with four branches among the top 10 largest firms in Middle- and Eastern
Europe (Deloitte, 2014). Trans-nationalisation and relocation of production have gained in importance.
However, as Krzywdzinski (2008, p. 24) explains German firms still show an investment orientation towards
employee training and engage in pilot cooperation projects with local vocational schools. Truett (2013, p. 2) argues that “the German manufacturing system is considered to be characterized by a superior way of organizing production”,
called diversified quality production or DQP, which is centred around a particular type of craft organization based on the concept of Beruf, or specific skills. It was based on specialized vocational and apprenticeship training, workplace codetermination, and collective
bargaining.
The number of models of German vehicles has substantially increased over time. In 1980
there were about 160 different models of German cars, this number increased to 260 by 2000 (Truett & Truett, 2013, p. 2) and probably is even
higher today thus more opportunities for further economies of scale should have arisen.
With a wider model range the risk of a ‘flop’ can be moderated. Daimler’s Vaneo (planned production 50.000 per year, only sold 55.000 from 2001-2005) and VW’s Phaeton (planned production 20.000 per year, only sold 25.000 from 2002-2006).
However, it seems that currently the German car manufacturing industry cannot compete globally solely on a cost basis, it therefore follows, that Germany’s reputation for quality and other
characteristics important to consumers will continue to be critical for future global success of the industry. It appears Dankbaar (2011, p. 7) is right in saying, “the German car manufacturers are
all set on a strategic course which is emphasizing scope, more than scale: product innovation more than productivity.”
3.4 The Pharmaceutical Industry
The pharmaceutical industry may be a good example of diseconomies of scale with severe
price competition and strong government regulations.
Externally viewed it seems governmental regulations increase R&D costs such that the
pharmaceutical industry can be considered a diseconomy of scale with as these costs massively increase unit costs.
Despite internal economies of scale for manufacturing and marketing costs, the high
R&D costs to produce a new drug, are of critical importance strategically. To increase its product range a company first must heavily invest in developing and testing a potentially new drug
before they can offer it for sale. Manufacturing and marketing combined will often outweigh R&D but nonetheless it is an important growth driver.
Internal economies of scale come in different shapes, e.g. it is easier for large firms
to carry the overheads of sophisticated R&D that is crucial in the pharmaceutical industry. The ever increasing costs of discovering the next blockbuster drug us have triggered several
mergers of pharmaceutical companies in recent years underpinned by the desire to spread R&D expenditures across a greater volume of sales. (Danzon, 2006)
Costs in R&D as the largest factor in the pharma industry are widely determined by
tight governmental regulations regarding testing and approval of new drugs which can easily take 10-15 years and so increase costs even more. The average costs of bringing a new drug to the
market is $1.3 billion (Herper, 2012). Finally a patent may be granted for the drug giving exclusivity rights typically for about 20 years.
When the patent protection for the drug expires, a generic drug is usually developed and sold by a competing company which opens a new market opportunity. Firms operating on that basis do not
have the extensive costs for R&D and would have all the possibilities to make use of economies of scale and therefor find their optimal minimum efficient scale.
4. Conclusions
The minimum efficient scale is the bare minimum size of a corporation
necessary for the lowest cost production. Beneath the minimum efficient scale there are diseconomies of scale due to the small size of the company. As the scale of productivity rises the business
becomes more proficient and experiences growing economies of scale. Over the minimum efficient scale there are also diseconomies of scale as companies grow, the management may become less
organized, and costs typically increase. Therefore, there is pressure on companies to expand until they reach the dimension of minimum efficient scale. Thereafter, a company may still expand
through mergers, acquisitions or invasions but this will be dictated by corporate objectives as much as the need to realize minimum efficient scale.
References
Begg, D. & Ward, D., 2013. Economics for Business. 4th ed. Maidenhead(Berkshire): McGraw-Hill Education.
Dankbaar, B., 2011. Scale and Scope Strategic Choices in the German Passenger Car Industry (Working Paper). Nijmegen: Radboud University Nijmegen, School of Management .
Danzon, P. M., 2006. Economics of the Pharmaceutical Industry. [Online] Available at: http://www.nber.org/reporter/fall06/danzon.html [Accessed 23 10 2015].
Deloitte, 2014. Top 500 Central Europe 2014.
[Online]
Available at: http://www2.deloitte.com/content/dam/Deloitte/global/Documents/About-Deloitte/ce-top500-2014.pdf
[Accessed 22 10 2015].
Forster, C.-P., 2004. Standort Deutschland - Zustand und Perspektiven. Speech at IHK Bochum's New Year reception. Bochum: Industrie- und Handelskammer Mittleres Ruhrgebiet.
Froeb, L. M., McCann, B. T., Shor, M. & Ward, M. R., 2014. Managerial Economics: A Problem Solving Approach. 3rd ed. Mason(OH): South-Western Cengage Learning.
Gillespie, A., 2014. Foundations of Economics. 3rd ed. Oxford: Oxford University Press.
Herper, M., 2012. The Truly Staggering Cost Of
Inventing New Drugs. [Online]
Available at: http://www.forbes.com/sites/matthewherper/2012/02/10/the-truly-staggering-cost-of-inventing-new-drugs/
[Accessed 23 10 2015].
IPA, 2015. Economics: MSc in Business and Management. Dublin: Institute of Public Administration, Education Division.
Jürgens, U., Krzywdzinski, M. & Teipen, C., 2006. Changing Work and Emplyoment Relations in German Industries – Breaking Away from the German Model? (Discussion Paper SP III 2006-302), Berlin: Wissenschaftszentrum Berlin für Sozialforschung.
Krzywdzinski, M., 2008. Work models under strain of offshoring: East-West competition in the european car industry, Berlin: Wissenschaftszentrum Berlin für Sozialforschung.
Mankiw, N. G., 2012. Principles of Economics. 6th ed. Mason(OH): South-Western, Cengage Learning.
McConnell, C. R. & Brue, S. L., 2008. Economics: Principles, Problems, and Policies. 17th ed. New York(NY): McGraw-Hill/Irwin.
Montague, G., Glassey, J. & Mohan, P., 2006. Pharmaceutical Operations Management: Manufacturing for Competitive Advantage. New York(NY): McGraw-Hill Professional.
Panzar, J. C. & Willig, R. D., 1981. Economies of Scope. American Economic Review, 71(2), pp. 268-272.
Porter, M. E., 1979. How competitive forces shape strategy. Harvard Business Review, March-April 1979, pp. 137-145.
Porter, M. E., 1985. Competitive Advantage: Creating and Sustaining Superior Performance. 1st ed. New York(NY): The Free Press.
Silberston, A., 1972. Economies of Scale in theory and practice. The Economic Journal, 82(325), pp. 369-391.
Smith, A., 1976. An inquiry into the nature and causes of the wealth of nations. Facsimile of 1904 ed. Chicago: University of Chicago Press.
Spatz, J. & Nunnenkamp, P., 2002. Globalization of the Automobile Industry-Traditional Locations under Pressure? (Working Paper). Kiel: Christian-Albrechts-Universität zu Kiel, Institute of World Economics.
The Economist, 2014. Big carmakers: Kings of the
road. [Online]
Available at: http://www.economist.com/news/business/21593468-size-not-everything-mass-market-carmakers-it-helps-kings-road [Accessed 21 10 2015].
Truett, D. B. & Truett, L. J., 2013. The German
Motor Vehicle Industry: Costs and Crisis (Working Paper). San Antonio(TX): The University of Texas, College of Business.